
ndh
About ndh

ndh's Achievements
0
Reputation
-
I have mapped a network drive to some shared folder on another computer in our network. If this other computer happens to be turned off, trying to access the network drive takes up to 2 minutes before timing out. How can I adjust this timeout value? Note: This has nothing to do with Windows automatically disconnecting network drives after a couple minutes, which is what almost all the google results are about.
-
No, not yet. I'm going to report back as soon as I get another one. Thank you all for your help so far!
-
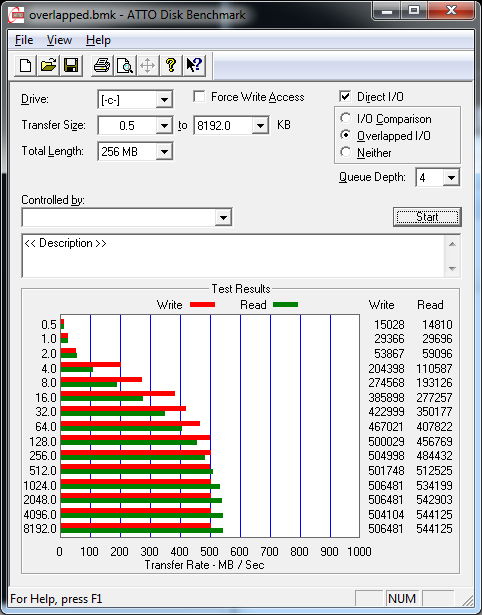
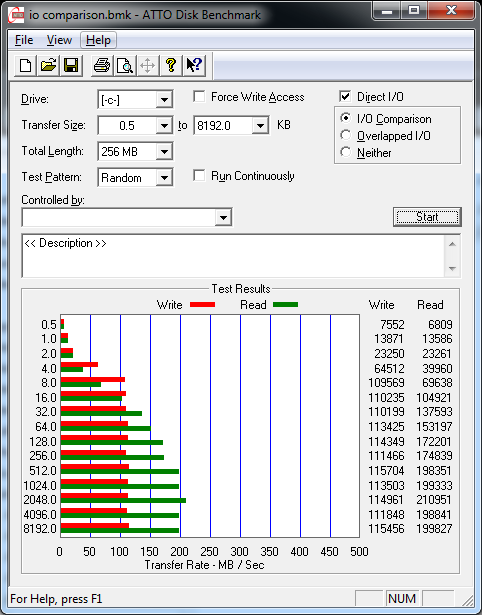
Here are some benchmark results. Not sure if those parameters make sense. Also, thank you for your help so far.

-
Here are the SMART values for both disks. ---------------------------------------------------------------------------- CrystalDiskInfo 5.2.2 (C) 2008-2012 hiyohiyo Crystal Dew World : http://crystalmark.info/ ---------------------------------------------------------------------------- OS : Windows 7 Professional SP1 [6.1 Build 7601] (x86) Date : 2013/01/16 10:29:16 -- Controller Map ---------------------------------------------------------- + Standard-Zweikanal-PCI-IDE-Controller [ATA] - ATA Channel 0 (0) - ATA Channel 1 (1) + Intel(R) 6 Series/C200 Series Chipset Family 6 Port SATA AHCI Controller - 1C02 [ATA] + ATA Channel 0 (0) - Hitachi HTS541010A9E680 ATA Device + ATA Channel 1 (1) - Corsair Force 3 SSD ATA Device + ATA Channel 3 (3) - Optiarc DVD RW AD-7800H ATA Device -- Disk List --------------------------------------------------------------- (1) Hitachi HTS541010A9E680 : 1000,2 GB [0/2/0, pd1] (2) Corsair Force 3 SSD : 120,0 GB [1/3/0, pd1] - sf ---------------------------------------------------------------------------- (1) Hitachi HTS541010A9E680 ---------------------------------------------------------------------------- Model : Hitachi HTS541010A9E680 Firmware : JA0OA480 Serial Number : J5400071G67XSD Disk Size : 1000,2 GB (8,4/137,4/1000,2) Buffer Size : 8192 KB Queue Depth : 32 # of Sectors : 1953525168 Rotation Rate : 5400 RPM Interface : Serial ATA Major Version : ATA8-ACS Minor Version : ATA8-ACS version 6 Transfer Mode : SATA/600 Power On Hours : 282 hours Power On Count : 184 count Temparature : 27 C (80 F) Health Status : Good Features : S.M.A.R.T., APM, 48bit LBA, NCQ APM Level : 4080h [ON] AAM Level : ---- -- S.M.A.R.T. -------------------------------------------------------------- ID Cur Wor Thr RawValues(6) Attribute Name 01 100 100 _62 000000000000 Read Error Rate 02 100 100 _40 000000000000 Throughput Performance 03 186 186 _33 001200000001 Spin-Up Time 04 100 100 __0 000000000124 Start/Stop Count 05 100 100 __5 000000000000 Reallocated Sectors Count 07 100 100 _67 000000000000 Seek Error Rate 08 100 100 _40 000000000000 Seek Time Performance 09 100 100 __0 00000000011A Power-On Hours 0A 100 100 _60 000000000000 Spin Retry Count 0C 100 100 __0 0000000000B8 Power Cycle Count BF 100 100 __0 000000000000 G-Sense Error Rate C0 100 100 __0 00000000000A Power-off Retract Count C1 100 100 __0 000000000D62 Load/Unload Cycle Count C2 222 222 __0 00340011001B Temperature C4 100 100 __0 000000000000 Reallocation Event Count C5 100 100 __0 000000000000 Current Pending Sector Count C6 100 100 __0 000000000000 Uncorrectable Sector Count C7 200 200 __0 000000000000 UltraDMA CRC Error Count DF 100 100 __0 000000000000 Load/Unload Retry Count ---------------------------------------------------------------------------- (2) Corsair Force 3 SSD ---------------------------------------------------------------------------- Model : Corsair Force 3 SSD Firmware : 5.03 Serial Number : 12076500000008950036 Disk Size : 120,0 GB (8,4/120,0/120,0) Buffer Size : Unknown Queue Depth : 32 # of Sectors : 234441648 Rotation Rate : ---- (SSD) Interface : Serial ATA Major Version : ATA8-ACS Minor Version : ACS-2 Revision 3 Transfer Mode : SATA/600 Power On Hours : 365 hours Power On Count : 5 count Host Reads : 310 GB Host Writes : 252 GB Temparature : 30 C (86 F) Health Status : Good (100 %) Features : S.M.A.R.T., APM, 48bit LBA, NCQ, TRIM APM Level : 00FEh [ON] AAM Level : ---- -- S.M.A.R.T. -------------------------------------------------------------- ID Cur Wor Thr Raw Values (7) Attribute Name 01 120 120 _50 00000000000000 Raw Read Error Rate 05 100 100 __3 00000000000000 Retired Block Count 09 __0 __0 __0 2D94F20000016D Power-on Hours 0C 100 100 __0 00000000000005 Power Cycle Count AB __0 __0 __0 00000000000000 Program Fail Count AC __0 __0 __0 00000000000000 Erase Fail Count AE __0 __0 __0 00000000000048 Unexpected Power Loss Count B1 __0 __0 __0 00000000000000 Wear Range Delta B5 __0 __0 __0 00000000000000 Program Fail Count B6 __0 __0 __0 00000000000000 Erase Fail Count BB 100 100 __0 00000000000000 Reported Uncorrectable Errors C2 _30 _30 __0 00001E001E001E Temperature C3 100 100 __0 00000000000000 On-the-Fly ECC Uncorrectable Error Count C4 100 100 __3 00000000000000 Reallocation Event Count C9 100 100 __0 00000000000000 Uncorrectable Soft Read Error Rate CC 100 100 __0 00000000000000 Soft ECC Correction Rate E6 100 100 __0 00000000000064 Life Curve Status E7 100 100 _10 00000000000000 SSD Life Left E9 __0 __0 __0 000000000000AE Vendor Specific EA __0 __0 __0 000000000000FC Vendor Specific F1 __0 __0 __0 000000000000FC Lifetime Writes from Host F2 __0 __0 __0 00000000000136 Lifetime Reads from Host
-
I have updated the firmware (didn't check if it wasn't updated already) of the SSD earlier today, and haven't seen a blue screen since. But as far as I know they normally only occur like once a day. I don't know how to check SMART values. So does that mean that it is in fact the SSD that's causing this?
-
Exactly the same. (Edit: Wait, did you mean force shutdown? I've only tried the normal shutdown from the start menu.) The only difference is that it sometimes takes much longer for the system to respond when I use the physical button. And it's not a forced shutdown as far as I can tell, Windows still waits for e.g. notepad if there are unsaved changes. It would be great if there's some way to find out from the kernel dump what causes these blue screens. I just don't know how to read Windbg's output. E.g. the stack trace seems kind of incomplete. How can I get a full stack trace? The error says "The required data was not placed into memory because of an I/O error", but I don't know which device it tried to read from. I can't even tell what exactly failed, reading from a device or writing to memory.
-
Hello, on one of our machines, sometimes the following BSoD occurs about 10 seconds after pressing the power button in order to shut it down. Below is a dump from this morning. It just happened again, and this time, it even failed to create the dump with the message "Physical memory dump FAILED with status 0xC0000185." Any help would be appreciated. We use this Corsair SSD for the system partition. 1: kd> !analyze -v ******************************************************************************* * * * Bugcheck Analysis * * * ******************************************************************************* CRITICAL_OBJECT_TERMINATION (f4) A process or thread crucial to system operation has unexpectedly exited or been terminated. Several processes and threads are necessary for the operation of the system; when they are terminated (for any reason), the system can no longer function. Arguments: Arg1: 00000003, Process Arg2: 86ed75f0, Terminating object Arg3: 86ed775c, Process image file name Arg4: 83021e10, Explanatory message (ascii) Debugging Details: ------------------ PROCESS_OBJECT: 86ed75f0 IMAGE_NAME: csrss.exe DEBUG_FLR_IMAGE_TIMESTAMP: 0 MODULE_NAME: csrss FAULTING_MODULE: 00000000 PROCESS_NAME: csrss.exe EXCEPTION_CODE: (NTSTATUS) 0xc0000006 - The instruction at 0x%p referenced memory at 0x%p. The required data was not placed into memory because of an I/O error status of 0x%x. BUGCHECK_STR: 0xF4_IOERR DEFAULT_BUCKET_ID: VISTA_DRIVER_FAULT CURRENT_IRQL: 0 STACK_TEXT: b392fb9c 830e72a1 000000f4 00000003 86ed75f0 nt!KeBugCheckEx+0x1e b392fbc0 83064e5a 83021e10 86ed775c 86ed7860 nt!PspCatchCriticalBreak+0x71 b392fbf0 83064d9d 86ed75f0 86fb3d48 c0000006 nt!PspTerminateAllThreads+0x2d b392fc24 82e458fa ffffffff c0000006 0071f5cc nt!NtTerminateProcess+0x1a2 b392fc24 77557094 ffffffff c0000006 0071f5cc nt!KiFastCallEntry+0x12a WARNING: Frame IP not in any known module. Following frames may be wrong. 0071f5cc 00000000 00000000 00000000 00000000 0x77557094 STACK_COMMAND: kb FOLLOWUP_NAME: MachineOwner FAILURE_BUCKET_ID: 0xF4_IOERR_IMAGE_csrss.exe BUCKET_ID: 0xF4_IOERR_IMAGE_csrss.exe Followup: MachineOwner --------- 1: kd> !thread THREAD 86fb3d48 Cid 0250.036c Teb: 7ffdb000 Win32Thread: ffb885e8 RUNNING on processor 1 Impersonation token: bfb91178 (Level Impersonation) DeviceMap a2162410 Owning Process 86ed75f0 Image: csrss.exe Attached Process N/A Image: N/A Wait Start TickCount 844543 Ticks: 962 (0:00:00:15.007) Context Switch Count 740 UserTime 00:00:00.015 KernelTime 00:00:00.000 Win32 Start Address 0x7570499a Stack Init b392fed0 Current b392fac8 Base b3930000 Limit b392d000 Call 0 Priority 15 BasePriority 13 UnusualBoost 0 ForegroundBoost 2 IoPriority 2 PagePriority 5 ChildEBP RetAddr Args to Child b392fb9c 830e72a1 000000f4 00000003 86ed75f0 nt!KeBugCheckEx+0x1e b392fbc0 83064e5a 83021e10 86ed775c 86ed7860 nt!PspCatchCriticalBreak+0x71 b392fbf0 83064d9d 86ed75f0 86fb3d48 c0000006 nt!PspTerminateAllThreads+0x2d b392fc24 82e458fa ffffffff c0000006 0071f5cc nt!NtTerminateProcess+0x1a2 b392fc24 77557094 ffffffff c0000006 0071f5cc nt!KiFastCallEntry+0x12a (FPO: [0,3] TrapFrame @ b392fc34) WARNING: Frame IP not in any known module. Following frames may be wrong. 0071f5cc 00000000 00000000 00000000 00000000 0x77557094 https://dl.dropbox.com/u/23962852/2013.01.14%20MEMORY.7z Please let me know if the download doesn't work.